Line of Balance with Powerproject
Overview
In projects where multiple resources work across different locations it is often difficult to identify conflicts or visualize who is working where at the same time so as to optimize the plan – or get the work done in the shortest time possible.
For example, when building a house there are various build stages to complete. On a site with multiple house plots these are often planned consecutively – example with 1 house starting per week or 2 houses planned to complete each week. However this may not be optimizing the use of trades on the site. Traditionally, in the Gantt chart it has been difficult to visualize the movement of individual trades across the site and this is the benefit of Line of Balance graphs.
LOB graphs allow users to visualize the flow of resources through work locations, helping to plan work & resources as effectively as possible, identify conflicts and optimize timescales.
This method of planning is known as ‘location based planning’ and is different to the activity based critical path method. It focuses on the progress of work crews as they move through a site or building. The goal is to maintain the work crew’s productivity rate as they move from location to location and minimize the number of starts and stops.
How is it used? The house building environment can be used to illustrate the usefulness of Line of Balance graphs.
In the diagram below, each bar relates to a different house plot i.e ‘location’ and each differently-coloured task relates to a ‘stage’ or activity that must be carried out on that house by a particular trade.
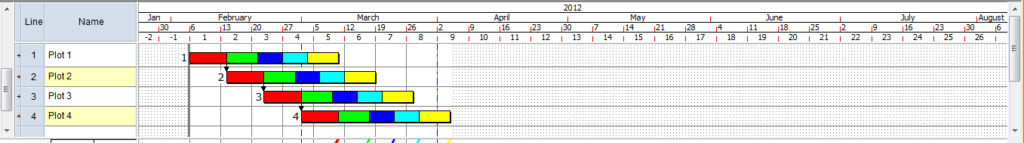
Code libraries are used to represent the locations & stages of work.’ Location’ code libraries – one for each plot for example – are assigned to the bars. Stage code libraries are assigned to each task.
This enables a Line of Balance graph to be produced.
In a Line of Balance graph, the repetitive work of each stage is shown as a single line, as illustrated below:
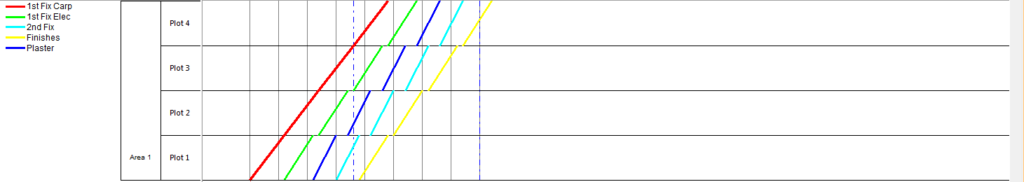
The rate of production of a stage is indicated by the steepness of its line – the steeper the line, the greater the rate of production – and the relationship of one stage to the subsequent stage is indicated by the space between the lines. The illustration above depicts a favorable scenario, in which there are no conflicts; the continuous line in the Line of Balance graph for trade 1 shows that the start of that stage at each location follows on immediately after the finish of the stage in the previous location. Whereas in the more complex example below there are some conflicts of trades in the same location demonstrated by the clash of lines on the graph.
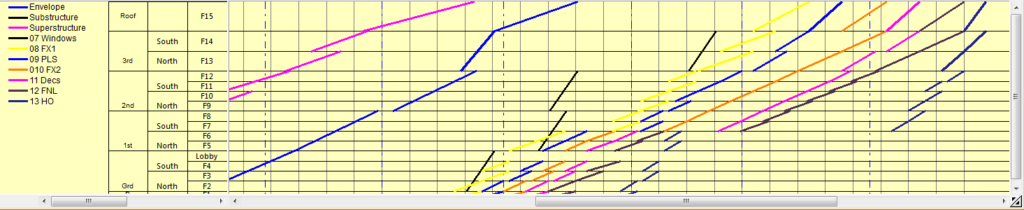
Using the graph it is easier to see where changes can be made to resolve conflicts of trades or optimise productivity.
The planner can experiment with different ‘gang sizes’ or by simply clicking & dragging the lines on the graph they can move the position of tasks & see the effect of this on the schedule. Similarly any changes made to the tasks on the bar chart are immediately seen in the LOB graph.
Who would use it?
This technique is specifically relevant to planning situations where repetitive processes occur in different locations & has traditionally been used in housing projects – where the same sequence of work must be carried out for each plot – but is just as valid to the construction of any multi-unit building: Flats/apartments/office blocks/hotels or the finishing stages of any type of project where work location can be specified.
What’s the benefit?
The presentation of LOB graphs alongside the bar chart greatly simplifies the planning process for this particular group of users. But more than this it also offers location based management capability without moving away from the familiar Gantt chart interface and the combination of these 2 planning types means that solution is suited to any type of project.