
Tilos — Time-Location Planning for Linear Infrastructure
Trimble
On a road, a railway, a pipeline or a tunnel the crews move along the work. A bar chart hides that movement; a time-location chart shows it. Tilos puts distance on one axis and time on the other, so the plan reads as what will actually happen on the ground — who is working where, in which week, and what is in their way.
Where it is used
- Road & highway — projects of any size and complexity, from single carriageways to major schemes
- Pipeline — crew separation, equipment move-arounds, permits, land acquisition and crossings
- Railway — dedicated track-building functions for the planner’s daily work
- Tunnel — drive sequences and face progress planned in the same view as the surface works
- Bridges & structures — repeated pile and foundation work generated in bulk, each at its own position
- Water engineering — harbors, canals, dikes, barrages and sheet pile walls along and across water
Why linear projects need a different chart
Traditional bar charts and network diagrams show when work happens, never where. On a linear project that omission is the whole problem: the constraint is usually access, sequence along the route, or two crews meeting at the same chainage. Tilos takes critical path planning and adds distance as a second dimension, so environmental restrictions, permits, crossings and risk elements sit on the same page as the schedule.
The result is a plan a site team and a client can both read. Progress is measured by location as well as by percentage, and variance against the baseline is visible where it occurs rather than buried in a column of dates.
What the software does
Scaled Location Charts
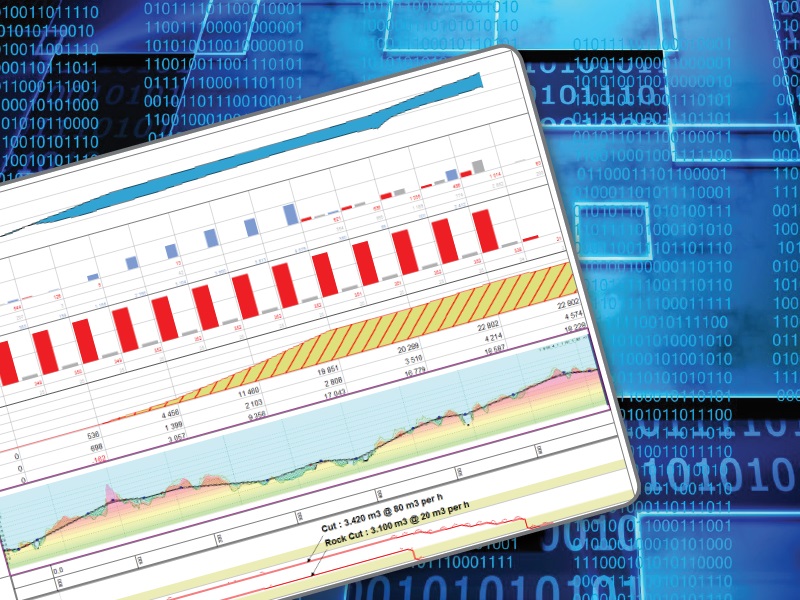
Route diagrams imported and scaled automatically, symbols and objects placed by distance coordinate, the chart split into sections to carry site plans, stages of construction and resource usage in one view.
Resource & Cost Planning
Durations calculated from working speed and distance, or from quantity and productivity. Resource utilization, cost and income curves over the project, compared against a baseline or another profile.
Customizable Views
Gantt, time-location, cost and resource diagrams and spatial information combined in one chart, with axis orientation set per cell so the same data can be presented several ways.
Mass Haul Data & Diagrams
Cut, fill and disposal defined by location and quantity, tasks generated from quantity and productivity for each movement, consumption shown by location or by time.
Progress Tracking
Progress recorded by location as well as by time and percentage complete, deadlines recalculated from the data date, earned value measures at task and sub-project level, distance progress shown as a distance Gantt.
Open Data Exchange
Two-way exchange with Primavera P6, Microsoft Project and Asta Powerproject; site data such as mass haul, elevation and site maps imported; quantities, equipment and costs brought in from spreadsheets.
ProgressMap — the schedule on the map
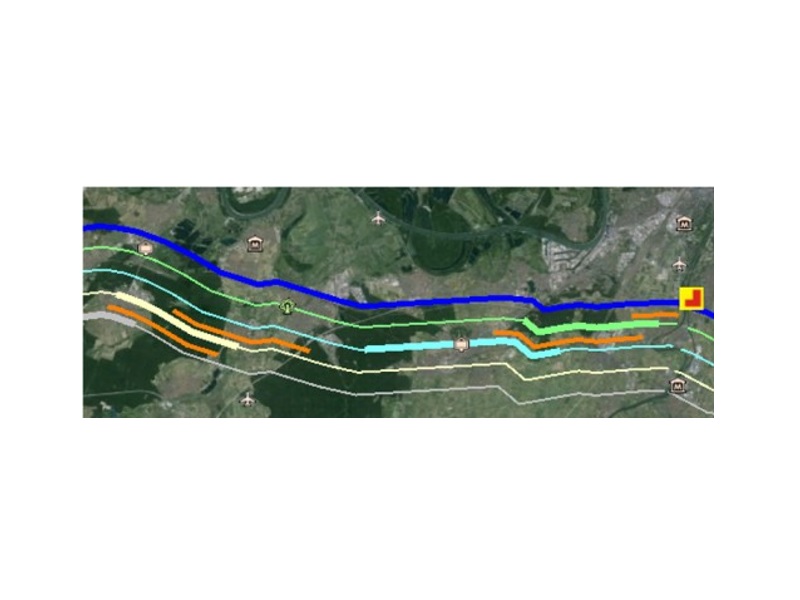
ProgressMap is a Tilos add-on that ties the schedule to real geography. It imports KMZ geometry — paths, place marks, polygons — connects each path point to a Tilos distance coordinate, and writes back a static or animated KMZ in which color carries progress. Any viewer that reads KMZ, Google Earth or ESRI among them, becomes a progress display for the whole route.
Licensing
Standalone
Installed on a single Windows workstation; the license is tied to that machine.
Portable
Installed on a USB stick and usable on any Windows workstation, with nothing copied or registered locally. The license travels with the stick.
Floating network
Installed on many machines with the license held centrally in a shared folder. A license is taken when the software opens and released when it closes, so concurrent users can be far fewer than occasional users. Works over a WAN or published through Remote Desktop or Citrix.
Company
Installed on many machines, with access controlled by a named-user list held in a shared folder. The list can be edited. Suited to larger deployments where specific people need assured access.
Licenses can be shared between team members, which is usually where the cost case is made.
System requirements
Tilos runs on Windows workstations. Hardware, operating system and exchange-format support change with each release, so the current requirements are the ones Trimble publishes for the version being deployed — APP confirms them against your environment as part of any installation or upgrade.
Also from Trimble
Quantm works upstream of the schedule: it generates and compares thousands of feasible road or rail alignments against terrain, geology, land use and cost, so the corridor is chosen on evidence rather than on the first workable line. Trimble Quantm alignment planning.
How APP works with Tilos
APP plans linear projects in Tilos and integrates the result with the CPM schedule the contract actually runs on — see Planning, Scheduling & Project Controls. Implementation, template setup and training are delivered as a service rather than as a product handover.